Charts
Malt Potential and Colour Chart
Pale base malt has a potential near 37 points per pound per gallon on a typical maltster's analysis sheet, and color contribution is estimated with the Morey equation: SRM equals 1.4922 times MCU to the 0.6859 power, where MCU is each grain's weight times its degrees Lovibond, summed and divided by the batch size in gallons.
What malt potential means
Malt potential describes how many gravity points a pound of a given grain can contribute when fully converted and dissolved into a gallon of wort, expressed as points per pound per gallon, commonly abbreviated PPG. It is a published figure that comes from the maltster's own analysis of that grain, tested under laboratory conditions that assume complete conversion and extraction, conditions no home brewing mash actually reaches, which is why an efficiency percentage always sits between a grain bill's theoretical potential and the gravity a brewer actually measures.
Pale base malt, the workhorse grain behind the overwhelming majority of all-grain recipes, has a potential near 37 points per pound per gallon on a typical maltster's analysis sheet. That figure varies somewhat by maltster, by malt variety and by the specific lot's moisture content, so a bag's own analysis sheet, when available, is always more accurate than a generic reference figure. Other malt types, from crystal malts to roasted specialty grains, each carry their own potential figure on their own analysis sheet, and those vary widely enough by type that this chart does not attempt to generalize them into a single number.
Turning potential into an estimated original gravity
The math connecting a grain bill to an expected original gravity is straightforward once you have a potential figure and an efficiency assumption. Multiply the grain weight in pounds by its potential in points per pound per gallon, multiply that by the mash efficiency as a decimal, then divide by the batch size in gallons to get the gravity points contributed per gallon. A commonly used efficiency assumption for a typical home all-grain system is 72 to 75 percent, a widely repeated convention rather than a fixed law, since efficiency depends heavily on crush, mash thickness, lautering technique and equipment.
| Grain weight | Batch size | Efficiency (convention) | Gravity points contributed | Approx. OG contribution |
|---|---|---|---|---|
| 8 lb | 5 gal | 75% | 44 points | 1.044 |
| 10 lb | 5 gal | 75% | 56 points (55.5 rounded) | 1.056 |
| 12 lb | 5 gal | 75% | 67 points (66.6 rounded) | 1.067 |
| 10 lb | 6 gal | 75% | 46 points (46.25 rounded) | 1.046 |
| 6 lb | 5 gal | 70% (common for brew-in-a-bag) | 31 points (31.08 rounded) | 1.031 |
Reading that table
Every row starts from the same published 37 PPG figure for pale base malt and simply changes the weight, batch size or efficiency assumption, which is the entire calculation behind a grain bill calculator. The efficiency number is always the weakest link, since it is a convention estimated from a brewer's own system history rather than a fixed property of the grain, and a brewer who tracks their actual efficiency over several batches gets a far more accurate prediction than one borrowed from a generic percentage.
What points per pound per gallon actually measures
A PPG figure comes from a standardized laboratory analysis performed under ideal, fully optimized conditions, a fine crush and a controlled mash designed to extract as much fermentable material from the grain as the grain is physically capable of giving up. No home mash tun reproduces those laboratory conditions, because a home crush is coarser to keep the lauter running smoothly and a home mash rest, however carefully managed, does not match a lab's precision. The gap between that laboratory potential and what a real system actually extracts is exactly what a mash efficiency percentage is measuring, which is why potential and efficiency always appear together in a gravity estimate and neither figure means much without the other.
This is also why the maltster's own analysis sheet, when one comes with a specific bag or order, is the real authority on that grain's potential rather than any generic published figure. Malt is an agricultural product, and its actual starch content shifts somewhat with growing conditions and moisture from one harvest and one delivery to the next, so a maltster re-tests and re-publishes a fresh potential figure for each batch it processes. A generic figure like the roughly 37 PPG commonly cited for pale base malt is a dependable average across many such lots, useful for planning before a specific bag is in hand, but the printed lot analysis always takes precedence once you have it.
How specialty malts differ from a base malt
Base malts like a standard pale or two row are fully modified, meaning their starch has already been broken down enough during malting that a simple single temperature mash converts nearly all of it, which is exactly what makes the 37 PPG figure and the enzyme activity behind it dependable across most base malt brands. Specialty and roasted malts are a different category entirely. Many of them, particularly heavily kilned or roasted grains, contribute far less fermentable extract pound for pound than a well-modified base malt, some contributing almost none at all, because the roasting or kilning process that gives them their color and flavor also destroys much of their starch and enzyme content in the process.
This is why specialty grains are added to a recipe in smaller amounts relative to the base malt, measured more often in ounces than pounds, and why substituting one specialty malt for another by weight alone, without checking each one's own potential and color rating, can shift both a recipe's expected gravity and its color more than a brewer might expect from what looks like a minor ingredient swap.
Color works on a completely different scale
Potential describes fermentable extract. Color describes something else entirely: how much the grain darkens the wort, measured in degrees Lovibond for individual malts and expressed for the finished beer as SRM in the United States or EBC in Europe. The standard method for estimating a recipe's color from its grain bill is the Morey equation, which first combines every grain's weight and color rating into a single number called MCU, malt color units, then converts that MCU figure into an SRM estimate.
MCU is calculated as the sum, across every grain in the bill, of that grain's weight in pounds multiplied by its color rating in degrees Lovibond, divided by the batch size in gallons. Once MCU is known, the Morey equation converts it to SRM with SRM equals 1.4922 multiplied by MCU raised to the 0.6859 power. Converting SRM to the European EBC scale is a straight multiplication: EBC equals SRM multiplied by 1.97.
The Morey equation worked out
Notice that SRM does not rise in a straight line with MCU. Doubling MCU from 20 to 40 does not double SRM, it moves it from about 11.7 to about 18.7, because the Morey equation uses a fractional exponent that flattens the curve at higher color values. That flattening is also the equation's known limitation: the Morey equation was fit to data from typical pale and amber beers, and its accuracy degrades for very dark beers, generally described as losing meaningful accuracy past roughly SRM 50, which covers the darkest stouts and porters. Brewers working with very dark grain bills often treat the Morey result for those beers as a rough indicator of relative darkness rather than a precise predicted number.
| MCU | SRM (Morey equation) | EBC |
|---|---|---|
| 5 | 4.5 | 8.9 |
| 10 | 7.2 | 14.3 |
| 20 | 11.7 | 23.0 |
| 30 | 15.4 | 30.3 |
| 40 | 18.7 | 36.9 |
| 50 | 21.8 | 43.0 |
How steeply color contribution scales with weight
Because MCU is weight multiplied by degrees Lovibond, and dark roasted grains carry Lovibond ratings many times higher than a pale base malt does, a small weight of a dark grain can equal or exceed the color contribution of a much larger weight of pale malt. As a purely hypothetical example to illustrate the math, not a specification for any real product: half a pound of a grain rated 300 degrees Lovibond in a 5 gallon batch works out to an MCU of 30, using the same weight times Lovibond divided by gallons formula from above. Reaching that identical MCU of 30 using a grain rated only 5 degrees Lovibond would take 30 pounds in the same 5 gallon batch, sixty times the weight, to contribute the exact same amount of color.
That is the practical reason recipes treat base malt and dark specialty grains so differently on the page, base malt measured in whole pounds and dark roasted grains measured in ounces. A brewer who doubles a roasted grain addition without checking its Lovibond rating against the rest of the grain bill can shift a recipe's color far more than doubling an equivalent weight of base malt ever would, since the color math scales with each grain's own Lovibond rating, not just its weight.
Where this chart stops on purpose
This page gives one solid, sourceable potential figure, pale base malt at roughly 37 PPG, because it is the figure this site's own calculators use and it is representative of what a maltster's own analysis sheet reports for a standard base malt. It deliberately does not extend that same confidence to crystal, roasted, or specialty malts, whose potential and color ratings vary too widely between maltsters and product lines to state as a single reliable figure here. The grain bill calculator and beer color calculator on this site ask for each grain's own potential and color rating as inputs precisely so that the specific malts in your recipe, not a generic table, drive the estimate.
Everything else worth considering
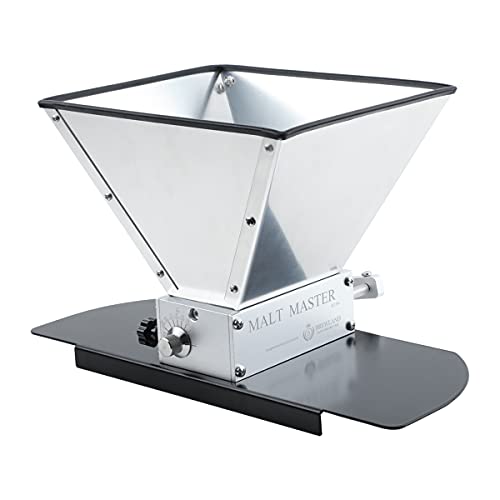
Brewland 2 Roller Grain Mill with Hopper
Adjustable two roller malt mill, which lets you crush your own grain and control efficiency directly.

Ferroday 2 Roller Stainless Grain Mill
Two roller stainless malt mill at entry pricing.
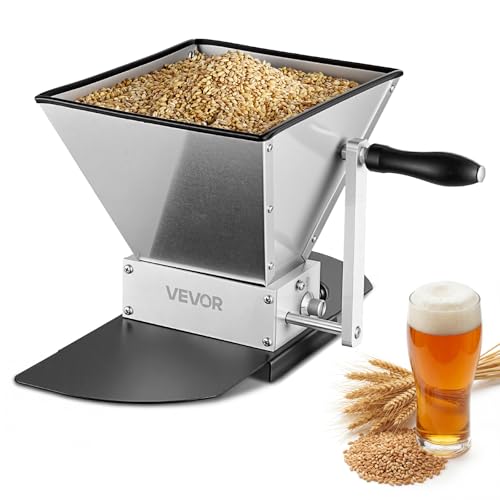
VEVOR Manual Grain Mill
Adjustable manual barley crusher for homebrew malt.

BOMATA 1 kg x 0.01 g Digital Scale
Wider range 0.01 g scale, which covers both salt additions and whole hop packets.

Bonvoisin Digital Lab Scale 600 g x 0.01 g
Laboratory balance with a draft shield style body, for brewers building water profiles by the tenth of a gram.
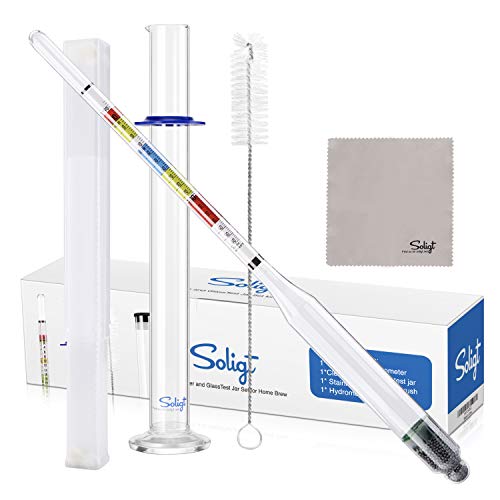
SOLIGT Triple Scale Hydrometer with Glass Test Jar
Hydrometer reading ABV, Brix and specific gravity, supplied with a glass jar.
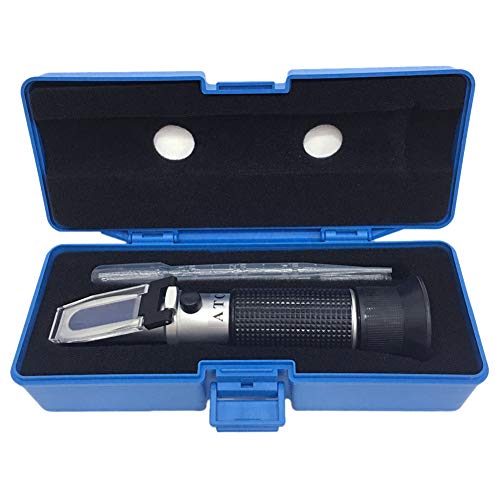
aichose Brix Refractometer with ATC (dual scale)
Dual scale Brix and specific gravity refractometer with automatic temperature compensation, which needs only two drops of wort.
Related on BrewGearCalc
- Grain bill calculator
- Beer color calculator
- Efficiency calculator
- Efficiency reference hub
- Specs reference hub
Frequently asked questions
- Why does my actual original gravity always come in lower than the grain's full potential?
- Because published potential figures like the roughly 37 PPG typical of pale base malt assume complete conversion and extraction under laboratory conditions, which no home mash fully achieves. The gap between full potential and what you actually measure is your system's mash efficiency, commonly somewhere in a 65 to 80 percent range depending on crush, mash thickness and lautering technique, and tracking your own efficiency over several batches gives a far better prediction than assuming a generic percentage.
- Does malt potential change with the grain's color?
- Not directly. Potential and color are two separate properties measured separately on a maltster's analysis sheet. A pale base malt and a crystal malt can have meaningfully different potentials, but color itself does not determine potential, some darker specialty malts still contribute usable fermentable extract while others are added purely for color and flavor with little fermentable sugar at all, which is why a grain bill calculator asks for both figures independently.
- What is MCU and why do I need it before I can get SRM?
- MCU, malt color units, is an intermediate step that combines every grain's weight and color rating into one number for the whole batch, calculated as each grain's weight in pounds times its degrees Lovibond, summed across the grain bill, then divided by batch size in gallons. The Morey equation needs that combined MCU figure as its input to estimate the batch's overall SRM, since color contributions from multiple grains do not simply add together in a straight line.
- Is the Morey equation accurate for a very dark stout?
- Its accuracy declines for very dark beers, generally described as losing meaningful precision past roughly SRM 50. For beers in that range, the calculated SRM is best treated as a rough relative indicator, useful for comparing two recipes against each other, rather than a precise predicted number you should expect a colorimeter reading to match exactly.
- What is the difference between SRM and EBC?
- They are two different scales for describing the same physical property, a beer's color, used in different regions: SRM in the United States, EBC across much of Europe. Converting between them is a straight multiplication, EBC equals SRM multiplied by 1.97, so a beer measured at 10 SRM is roughly 19.7 EBC, the same color described on two different scales.
- Should I use the maltster's analysis sheet or a generic PPG figure?
- Use the maltster's own analysis sheet whenever it is available, since it reflects the actual lot in your hands rather than a typical published figure. A generic figure like the roughly 37 PPG commonly cited for pale base malt is a reasonable stand-in when no lot-specific sheet is available, but it is an average, not a guarantee, and moisture content and variety differences can shift a specific lot's real potential up or down from it.
Researched from published brewing formulas, manufacturer specifications and verified owner reviews. This is general guidance, not professional advice.